Deficit Spending: What is the Long Term Effect?©
by
William Larsen
10 January 2004
For years politicians have measured deficit spending as a percent of Gross Domestic Product (GDP). GDP is the sum total of all goods and services produced in the United States. In 2002 the GDP was around $10 Trillion with federal budget revenues of $1.9 Trillion or about 19% of GDP. This 19% includes FICA taxes collected from both Employee and Employer. FICA taxes by law cannot be used for any purpose other than to pay for the Social Security and Medicare programs. FICA taxes are loaned to the US Treasury and in return are paid interest. The Medicare and Social Security programs are about 35% of total federal spending. In addition the Medicare and Social Security programs by law cannot borrow money.
Many have stated running 1.5 to 2% deficits are manageable. Is this true? Would your family budget survive having to borrow 1.5% of your income yearly? It is relatively simple for the layperson to check if this is a correct statement. A spreadsheet is ideal for this calculation. What we want to do is look at the long term trend.
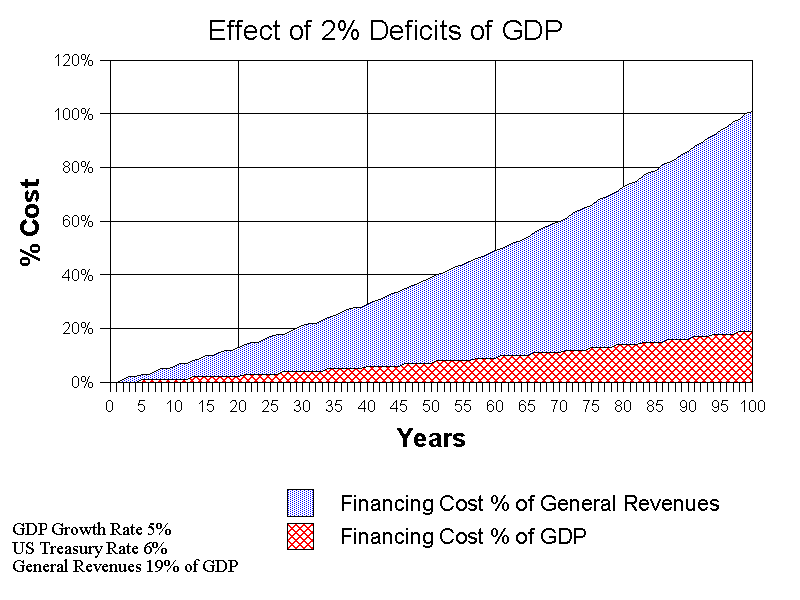
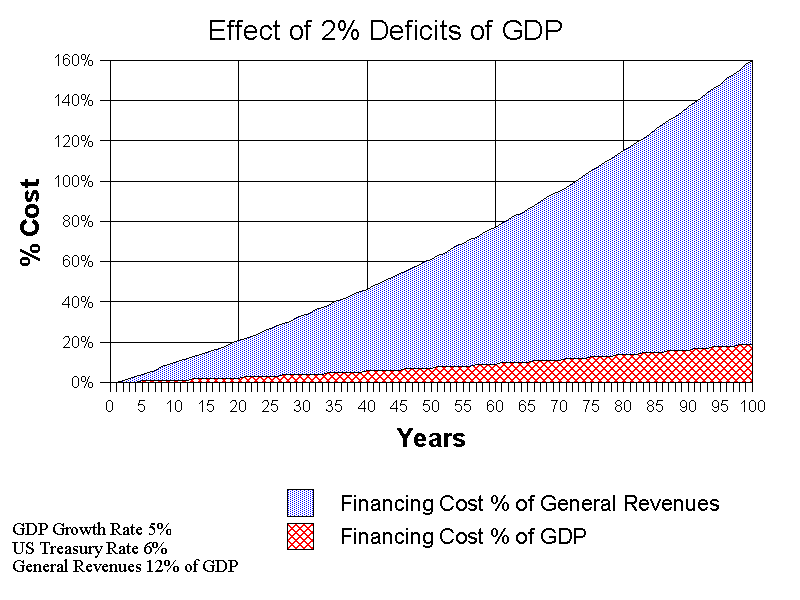
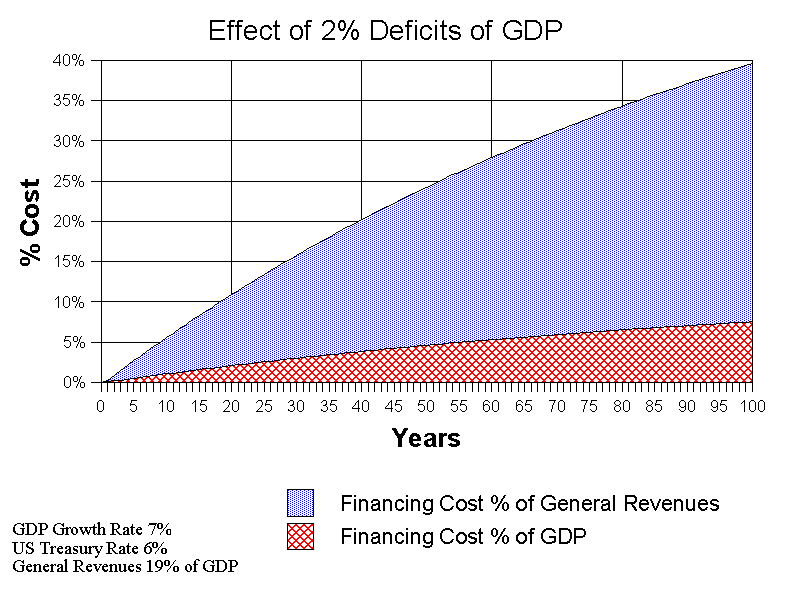
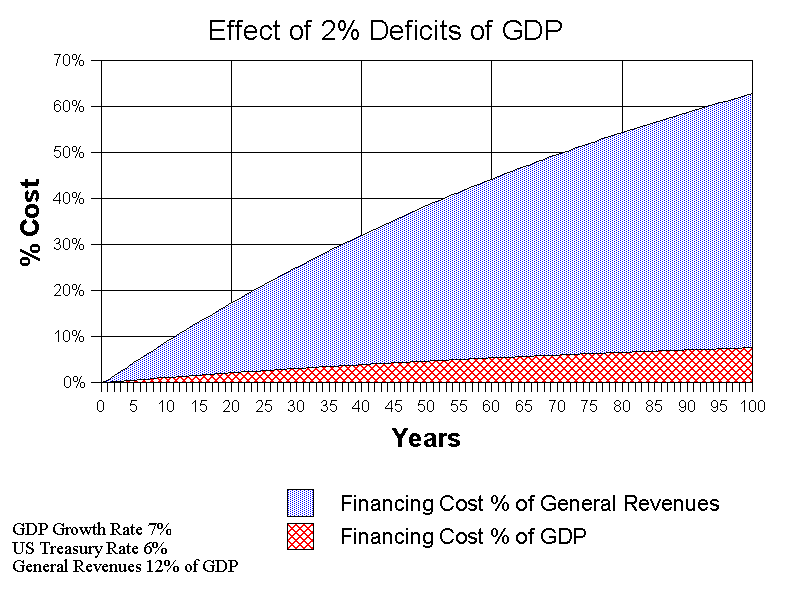
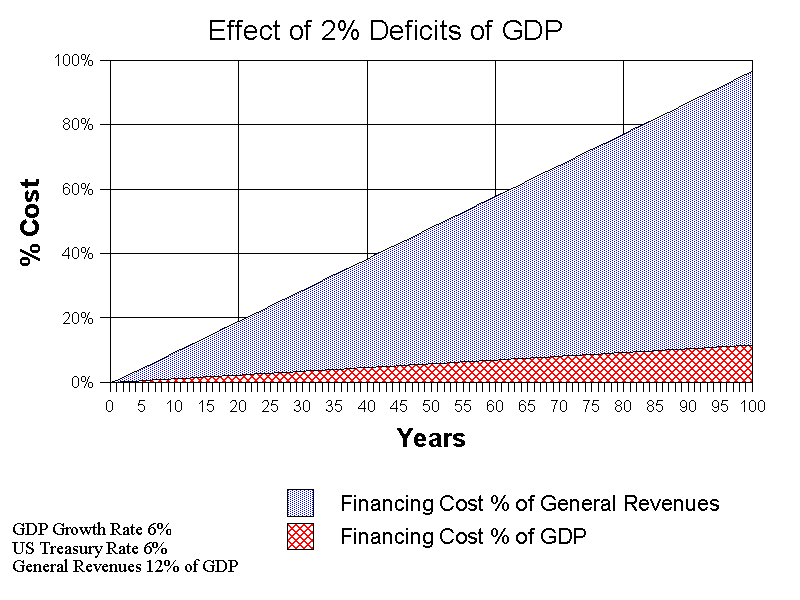
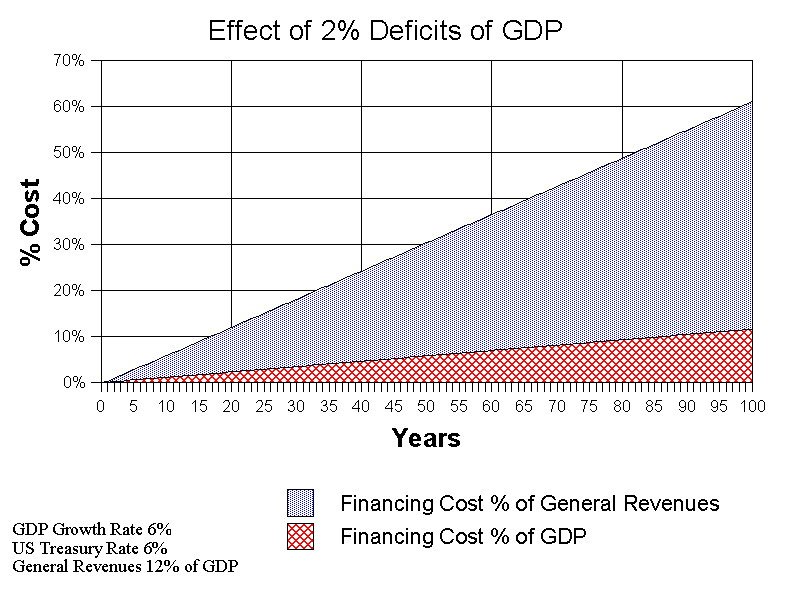
Separating out FICA revenues from federal revenues produces what I call General Revenues which are about 12% of GDP. Since Social Security and Medicare cannot borrow money, the deficit is attributed to the General Revenues. The purpose of showing both is to high light the dramatic difference between them. Politicians are misleading the American people by resorting to using Enron style accounting.
It does not mater if you do not use actual GDP numbers. We are interested in the Percent cost of financing deficits as a percent of GDP and of General Revenues. I began by using 100 as my GDP. In the first year 19% revenues of GDP would be 19, a 2% deficit of GDP would be 2 and interest amounts to 0.06. Financing Cost % of General Revenues is calculated by dividing Interest on Debt by General Revenues. Financing Cost % of GDP is calculated by dividing Interest by GDP. The Trend is not good. Judge for yourself.
|
Economic Growth |
6% |
|
|||||
|
US Treasury |
6% |
||||||
|
Deficit |
2% |
||||||
|
Revenues |
19% |
||||||
|
Year |
GDP |
General Revenues |
Deficit |
Interest on Debt |
Debt Balance |
Financing Cost % of General Revenues |
Financing Cost % of GDP |
|
0 |
$ - |
$ - |
$ - |
$ - |
$ - |
0.00% |
0.00% |
|
1 |
$ 100 |
$ 19 |
$ 2 |
$ 0.06 |
$ 2.06 |
0.29% |
0.06% |
|
2 |
$ 106 |
$ 20 |
$ 2 |
$ 0.18 |
$ 4.36 |
0.91% |
0.17% |
|
3 |
$ 112 |
$ 21 |
$ 2 |
$ 0.32 |
$ 6.93 |
1.52% |
0.29% |
|
4 |
$ 119 |
$ 23 |
$ 2 |
$ 0.48 |
$ 9.79 |
2.13% |
0.41% |
|
5 |
$ 126 |
$ 24 |
$ 3 |
$ 0.66 |
$ 12.98 |
2.74% |
0.52% |
|
6 |
$ 134 |
$ 25 |
$ 3 |
$ 0.85 |
$ 16.51 |
3.36% |
0.64% |
|
7 |
$ 142 |
$ 27 |
$ 3 |
$ 1.07 |
$ 20.41 |
3.97% |
0.75% |
|
8 |
$ 150 |
$ 29 |
$ 3 |
$ 1.31 |
$ 24.73 |
4.58% |
0.87% |
|
9 |
$ 159 |
$ 30 |
$ 3 |
$ 1.57 |
$ 29.49 |
5.19% |
0.99% |
|
10 |
$ 169 |
$ 32 |
$ 3 |
$ 1.86 |
$ 34.73 |
5.81% |
1.10% |
|
Click on the Chart for larger view |
|
|
Economic Growth 5% US Treasury 6% Deficit 2%
|
Economic Growth 5% US Treasury 6% Deficit 2%
|
|
Economic Growth 7% US Treasury 6% Deficit 2%
|
Economic Growth 7% US Treasury 6% Deficit 2%
|
|
Economic Growth 6% US Treasury 6% Deficit 2%
|
Economic Growth 6% US Treasury 6% Deficit 2%
|