Social Security's Rate of Return - The Beneficiary's View
There has been much talk and debate over what the rate of return is for a worker. It all depends on the economic assumptions. In this analysis, I have used a 2.75% inflation rate, 3.5% wage growth rate and 10.6% Social Security's OASI tax rate. In addition Social Security's life table for those age 67 was used. For the private account I have used 5% as the rate of return. For the Social Security analysis, the rate of return is calculated using an iterative routine.
Social Security currently increases benefits on a yearly basis by the change in the inflation. However, when the trust fund balance falls below 20% of the current years expenses, benefits will no longer be increased by COLA. This was legislated in 1983.
Summary
A minimum wage worker will earn a 4.7% rate of return if full benefits are paid. If taxes are raised or benefits reduced by 27% their rate of return is 3.85%. The average worker earns a 3.62% return while if benefits are reduced 27% will earn 1.44%.
A person who has a mortgage and paying 7% would in essence save 7% by applying the Social Security Contribution to the mortgage. This would greatly increase the amount at retirement.
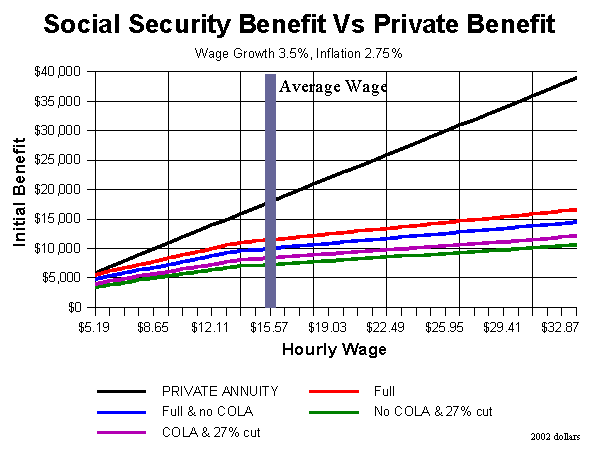
What is also clear is the non linear relationship between rate of return and benefits paid. A private account with average earnings, earning 5% on their money would have a benefit 56% larger than Social Security. If Social Security cannot pay full benefits then the private account earning 5% would be 114% larger than Social Security.
There are four scenarios.
Chart 1 shows the rate of return a worker can expect to earn on their Social
Security contributions based on their hourly wage.

Chart 2 shows the amount of the Social Security benefit based on your hourly
wage.

Chart 3 shows the difference between what a private account paying 5% and
what Social Security will pay based on the four scenarios. As is plainly clear,
even the minimum wage worker does worse with Social Security.
